⚰️ Why The Human Race is Going Extinct this Century
What if the rules of the game have already sealed our fate? This is a brutal mathematical reality: an unstoppable, self-reinforcing chain reaction in the Earth’s climate system is now underway. The choice before us is stark—immediate radical intervention or near-certain extinction.

Watch the Video Version This Essay - Recorded From Prison
I should start by explaining this title, not least because it refers to an event that will cause more suffering and injustice than any other scenario conceivable to the human mind: the premature death of 8 billion or more human beings in the next 75 years.
The title should not be read as meaning that this event is certain for two reasons: First, it is formally impossible to predict any future event with absoluteness. Secondly, it is possible that due to geo-engineering and other technological developments, we may reverse the process of global heating. However, it is questionable whether this technology exists, and if it does, whether it can be deployed at scale in the time available, given its enormous costs and in the context of widespread social collapse.
Without this intervention, however, human extinction is effectively inevitable. At the present moment, there are only two outcomes. First, to maintain a ‘highly developed’ economy and society, which can roll out these technologies. Or the end of humanity’s existence. There is no third scenario now, no regression or progression to some premodern society compatible with continued human life. There are only two equilibriums. Geoengineering or extinction.
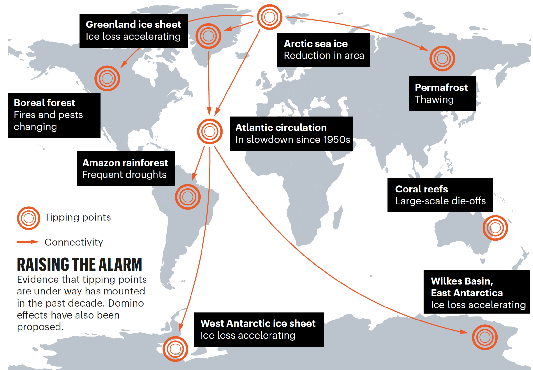
This is because tipping points in the Earth’s system have now been triggered12 due to the present level of human-created emissions and locked-in additional inputs of carbon lag and air pollution.5 The human race being effectively extinct by the end of the century is now the main scenario. This means that it is a lot more likely than not, possibly inevitable.
What is certain is that a level of social disruption more significant than any other period in human history is now locked in. I am writing this text due to the publication of new data, which now gives numerical starting points for the Earth system's four most significant non-living linear elements. Forest fires, methane release, ice melt, and natural carbon sinks. Soil, forest, and oceans. This data gives a good enough all-system picture of how runaway climatic collapse will happen over the coming decades.12
I want to do two things then: First, I want to show conclusively that a new methodology is needed to undertake accurate analysis—what I will call an all-system iterative approach. Second, I want to show that when this approach puts new numbers into its model, it will predict human extinction this century.
There is a vast and diverse literature on the philosophy and sociology of science, which is almost entirely ignored by conventional climate research and policy. This literature needs to be investigated to understand the intersection between ‘pure’ science and what is called data. The interpretation of that data is unavoidably conditioned by human bias—methodological, epistemological, and psychological.
For instance, it is unclear what data should be researched, at what scale to investigate phenomena, or how to view the causal relationships between elements. The answers to these questions depend upon human purpose, which is, by definition, a social matter.
As the seminal work The Structure of Scientific Revolutions shows, the very way we use data is conditioned by a paradigm of understanding, which becomes self-reinforcing. Even when another paradigm could better explain the data, thereby producing better predictions. Climate science has an increasingly poor record of making accurate predictions because it is embedded in a dysfunctional paradigm.
This failure reached crisis levels in 2024 due to the failure to predict or explain an underlying sustained jump of 0.2°C in global temperatures. The reason for this failure is the conventional methodologies' analysis of only parts of the system, falsely assuming that these processes are independent of other parts of the system. Therefore, it assumes linear rather than non-linear change.
This approach may have made sense in the past when all parts of the system were not linked up, but that is no longer the case. Only an all-system analysis can, therefore, make accurate predictions. There is now only one system, and that is the all-Earth system. To understand any part of the system, it is necessary to look at all of it.
Scientists also fundamentally misunderstand the social context of their research. The traditional approach is rooted in a culture that focuses on research matters that involve no risk to human beings. The purpose, then, is to establish the certainty of a hypothesis. In this context, a notion of a ‘conservative’ approach is one that requires a high level of supporting evidence to provide ‘proof.’
An example might be proof that a certain species of butterfly depends upon a certain flower. In this case, such a hypothesis has no social implications—no lives depend upon it. And so this traditional epistemological approach makes sense.
However, there is an opposite set of circumstances, namely where human lives are at risk. In this situation, what would be called a conservative approach has an opposite logic to such an approach when no lives are at risk. This can be illustrated by the example of a ‘conservative mother’ who will not allow her child to cross the road alone because the hypothesis that the child will be knocked over has a slight possibility of being correct.
This sort of conservative logic applies to contexts involving insurance, national security, health and safety, and the like. Self-evidently, the analysis of the danger of climatic change to human life firmly belongs in the latter category. A conservative approach means a realist approach, which has to take account of low probabilities. A high level of proof is not required to take action, but rather quite the opposite.
A classic example is the chance of an aeroplane crashing. Even the hypothesis that a tiny danger to the plane will lead to its crashing would be a matter of moral and legal obligation. The conservative approach, correctly defined in the context of mortal risk, requires, then, taking account of all hypotheses, even if they are supported by low levels of evidence.
This new approach is to not focus on parts of the system or individual data items but to put them together in ten-year sequential timeframes, starting in 2025. This way, we can see how the elements interact in real-time.

We can work this out using two types of crucial information. First, the starting numerical contribution of a factor that causes global temperature rises at the present time. For instance, factor A contributes 0.1°C to global warming every decade starting in 2025. The second piece of information is the ratio between an increase in temperature and an increase in the amount that this factor contributes to temperature rise.
For instance, factor ‘A’ may increase its contribution to global warming by 50% for every one-degree centigrade increase in average global temperatures. Once we have these two pieces of data for all significant factors, we can make an accurate prediction of the key data points in the system over time. The key data point is the increase in global temperatures at the end of each future decade or iteration.
The mathematical nature of the system can be illustrated by looking at the game of Monopoly, with which many people are familiar. When several people play the game, it is possible to make a near-absolute prediction that, although all the players start off with an equal amount of money, within the space of a few hours, one player will end up with all the money and all the others will have none.
We can create a simplified model to show how this works. Let's say the game has just two players. Player ‘A’ has a complete set of properties and is building houses and then hotels. At the same time, player ‘B’ has two sets of properties and is also building houses and hotels.
If we just analyse the player ‘A’ part of the system, we would predict that the future would involve getting more hotels and thus increasing prosperity. But this is clearly incorrect because this part of the system is intricately connected to player ‘B’s parts of the system. You obviously have to look at the whole board, the whole system, to make credible predictions.
The rules are that each player moves a marker in turn around the board, advancing a number of spaces shown by the sum of two thrown dice. There is a substantial chance of ‘A’ landing on ‘B’s properties and so having to pay rent, with the consequence of having no spare money to buy more houses and hotels.
We could say the estimate of the chances of ‘A’ landing on ‘B’s properties is 50% for each iteration, defined as the marker moving around the board once, while the chances of ‘B’ landing on ‘A’s lower number of properties are 25% during each iteration. The odds of ‘A’ not landing on ‘B’ and ‘B’ landing on ‘A’ are slight but not impossible—say, one chance in four.
If, however, ‘A’ lands on ‘B's properties, he will lose some of his houses in order to pay rent to ‘B’, and thus the chances of him winning will be reduced in a non-linear way, as he will be unable to charge as much if ‘B’ lands on his properties. In addition, he'll have to pay more money if he lands on ‘B's properties, as ‘B’ will be able to buy more houses and hotels with the rent money he gained from ‘A’ having just landed on his properties.
Let's say, then, in this new situation, ‘A’ has a 1 in 10 chance of winning. However, when he then lands on ‘B’ again, he will have to pay even more rent and have to sell all his houses. Now the chances of him winning suddenly fall to next to zero—say, one chance in a million.
For ‘A’ to win, ‘B’ has to land on his properties approximately ten times for ‘A’ to have enough money to start rebuilding houses again. And while during that whole time, if he lands on ‘B’s properties just once, he will have no money to pay the rent and go out of the game.
This, then, is non-linearity in action. 1 in 4 moves to 1 in 10, which then moves to 1 in 1,000,000.
The Earth’s system has the same essential structure. It is iterative, non-linear, while ‘going out of the game’ in this context means human extinction.
In the following analysis, I will not focus on the social effects of the various stages. I will simply show that these stages lead to the endpoint of human extinction. This reverses the conventional analyses, which look at the consequences of getting to a set level of temperature—for example, two degrees or three degrees—while the prospect of extinction is all but ignored.
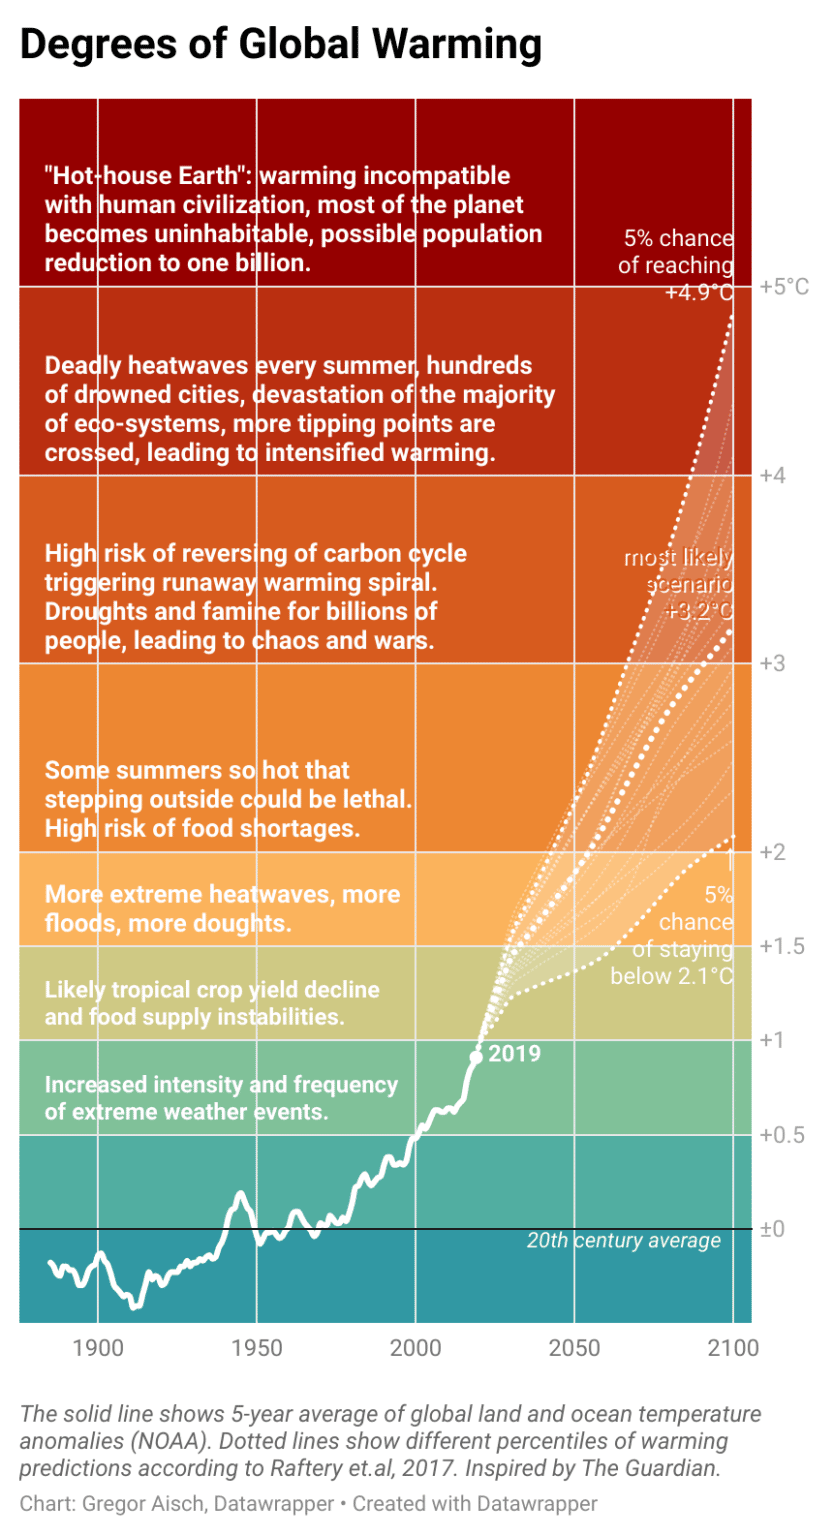
However, if we are certainly heading for extinction, this fact is self-evidently more important than the various social stages that lead to that destination.
The focus, then, moves from the incorrect conception of climate change as a set event—a point in time, such as reaching three degrees—to a correct conception of seeing it as part of a self-perpetuating and unending all-system process.
This new focus then enables us to see that the most important fact about arriving at three degrees centigrade is not the social consequences of passing that point in itself, but rather that three degrees centigrade will lead to four degrees centigrade, and so on.
The same point can be made in Monopoly. The most important fact about the loss of your houses is not the loss in and of itself, but that this development will lead to the close-to-inevitable consequence of losing even more houses, and then going out of the game in future iterations over the next few shakes of the dice.
With these realities in mind, I will analyse the data and ratios over decadal iterations.
2025 to 2035:
Establishing accurate initial conditions is crucial for the working out of any subsequent non-linear developments. For instance, if we double 2 & 3 several times, we can see the resulting figures increasingly diverge: 2, 4, 8, 16, 32, as opposed to 3, 6, 12, 24, 48.
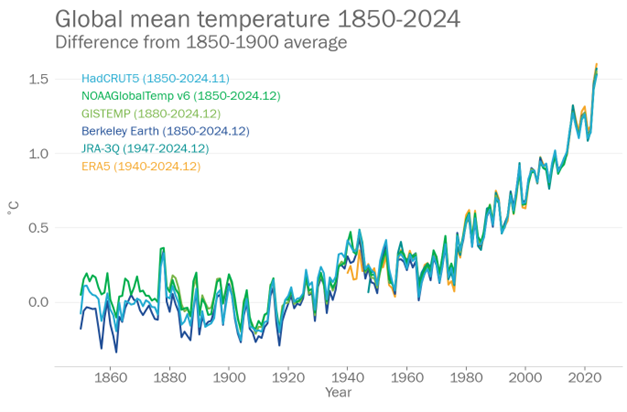
The present starting point for the Earth’s system is that the world is now at 1.5°C above pre-industrial temperatures.1,2
There is a confusion here, because conventional analysis takes the official figure as the average of the past ten years, or ten or more years. However, temperatures have been increasing significantly and consistently now for 30 years. And so a conservative analysis, using our risk analysis definition of conservative, would assume that the temperature increases are not suddenly going to stop or reverse. Not least because emission levels are still going up. It therefore makes rational sense to use the present temperature or at least an average of the last five years, and a projection of the next five, as a more accurate estimate of the present average global temperature increase.
The second relevant fact is that the rate at which temperatures have been increasing has itself been increasing over past decades. From 1970 to 2008, temperatures rose by 0.18°C per decade. From 2010, this is increased by 0.3 degrees per decade. Looking back over the past decade, temperatures have increased by 0.4°C.3,4 Leon Simon, a scientist who works with James Hansen, stated in September 2024: The past 16 months are warmer than any month before 2023, and comparing this with previous stronger El Niño, to the previous stronger El Niño, shows decadal warming rate of 0.42°C.3 Again, a correct conservative analysis would assume that the next decade will continue the exponential increase in temperatures, and the increase will be more than 0.3°C. Particularly in the light of the data mentioned by Simon. So we should assume that we need to add 0.4°C to 1.5 degrees, to get to 1.9°C in 2035.
However, in order to do our correct all-system analysis, we need to consider all other developments in the system. To continue our analogy, we need to look at who else is building houses on the Monopoly board. First, we need to take account of the effect of air pollution. The burning of fossil fuels puts small particles into the air (Aerosols), which reflects the sun's rays as and when fossil fuel burning stops, the particles will fall out of the atmosphere, allowing more of the sun's rays to enter the atmosphere and thus raise temperatures.5 There are numerous papers providing evidence for this and suggesting that when the burning stops, between 0.5°C and 1°C will be added to global average temperatures.
In addition, there has been estimated underlying temperature increase of 0.2°C during 2023 to 2024, which has been partially explained by the reduction of air pollution by global shipping. A conservative analysis has to take account of such an insignificant factor. For the purposes of this analysis, then, we will assume that the amount still to be added to the atmosphere by the removal of air pollution is 0.5°C and 0.1°C of this has already come through. This leaves 0.4°C to be added as future pollution levels decline.
We shall assume that pollution continues to decline over the coming decade. And so we need to add another 0.1°C to global temperatures by 2035, raising the running total from 1.9°C to 2°C.
Secondly, we need to add in the data from feedback processes over the parts of the system. I will take these one by one.
Forest fires: The Canadian fires at 2024 emitted the same amount of carbon as yearly emissions of the United States.7,8 The US emits 5 to 10 GT/Year. If we assume that an average of 7.5Gt/Year, then this is 19% of global emissions from human activities, which are presently at around 40Gt. Over the next ten years, 40Gt of human emissions will produce, we estimate, 0.4°C of heating. And so US emissions will produce one-fifth of that total: 0.08°C.
In view of the occurrence of major forest fire episodes in Canada, Siberia, and Australia since 2019, we can assume that over the next ten years, a 2024 Canada scenario will happen, on average, every two years. Bearing in mind, the average temperature over the next decade will be around 1.8°C. This means that additional temperature increases from forest fires over the next decade will be 0.08°C/2°C = 0.04°C.
Permafrost melt: The 2024 State of the Cryosphere report gives estimates of greenhouse gas emissions from melting permafrost at various levels of global warming.9 At 1.5°C, the estimate is 2.5Gt/Year—6% of annual total emissions. And so we should add 6% of the 0.4°C of these emissions, which is 0.02°C.
Loss of carbon sinks: The 2024 Stepping Back from the Precipice report calculates that one-third of human emissions are absorbed by land ecosystems: trees and soils.10,11 But the capacity to absorb these emissions has fallen by 20% in the last ten years. We can assume that this capacity will fall by at least another 20% in the next decade, as temperatures increase further by 0.5°C in the next ten years. A third of the total human emissions of 40Gt/Year is 13.3Gt/Year11, and 20% of this figure is 2.66Gt—7% of annual emissions. We should therefore add 7% of 0.4°C to the temperature rise, which is 0.03°C.
In addition, we need to take into account the effect of the falling ability of the oceans to absorb carbon. There are not precise figures on this factor, but again, using a conservative approach, we should take some account of it. So we could assume that the total effect of the loss of carbon sinks is 0.05°C.
Albedo effect of loss of ice cover: Estimates of the effect of a Blue Ocean Event in the Arctic—no sea ice in the summer—is 0.2°C13, an increase in global temperatures in the short term13, and this event is predicted to happen between 2030 and 2035. In addition, in 2023 to 2024, Antarctica's sea ice loss in one season was approximately the same area of ice cover as the amount which would need to melt for there to be a Blue Ocean Event in the Arctic. If this was an average yearly melt in Antarctica, then we can assume that this too would add 0.2°C to global temperatures. We assume that the joint effect of growing ice melt events will be 0.1°C between 2025 and 2035.
The total effect then, of all these feedback systems, is:0.21 (0.04 + 0.02 + 0.05 + 0.1)
Making the total increase in global temperatures in this time period 0.5°C + 0.21°C, making a total of 0.71°C.
Giving a new total of 2.21°C by 2035.
2035 to 2045
We assume during this decade there is a significant drop in human emissions in the region of 50% below present levels, not least due to the permanent world recession brought on by the economic effects of going over 2°C by 2035. Therefore, leading to a halving of the increase in temperatures to 0.2°C.
However, the effect of carbon emissions on creating higher temperatures can take over a decade for its full effect, with an overall delay of around 0.3°C. It is therefore generally accepted that even if human emissions stopped entirely tomorrow, temperatures would still increase for a number of decades. So we can assume that over this decade, temperatures will increase by 0.2°C due to the emissions from the previous decades, giving a running total of 0.4°C.
In addition, with a 50% drop in emissions during this decade, we can assume a 50% drop in air pollution, and so a real-time temperature increase of 0.2°C—half of the 0.4°C. This brings the running total to 0.6°C.
Next, then, we have to add in the projected effects of feedbacks from other parts of the system.
Forest fires: Given the surge in annual global temperatures from an average of 0.8°C during the previous decade to an average of over 2.6°C for this decade, we can assume the equivalent of the 2024 Canadian fire happening once a year, doubling the emissions from the previous decade. From this factor, that is 0.08°C (0.04 × 2).
Permafrost melt: According to the cryosphere report, temperatures at 2°C will result in 3 to 4 Gt/year of emissions. And so, given we start this decade at 2.22°C, we can assume emissions from permafrost will melt at 4 Gt/year. This is 10% of 40 Gt/year, which produces 0.4°C of temperature increases. And so, these emissions will result in a temperature increase of 0.04°C (0.1 × 0.4).
Loss of carbon sinks: If we assume another 20% loss over the decade in the ability of forest and soil to absorb emissions, along with a similar decrease in the ocean's capacity, then the additional temperature increase will be 0.05°C.
Albedo effect of loss of sea ice cover: There will be regular blue ocean events from 2034 in the Arctic and similar levels of sea ice loss in Antarctica, leading to a prediction of a temperature increase of 0.2°C for this decade.
The overall effect of all these feedback systems, then, is 0.37°C (0.08 + 0.04 + 0.05 + 0.2), making the total increase in global temperatures during this period: 0.6°C + 0.37°C, making a total of 0.97°C. Giving a new total of 3.18°C by 2045.
2045 to 2055
We assume that during this decade, human emissions dropped by half again, leading to a temperature increase of 0.1°C. The effect of carbon lag will lead to a last addition of this effect of 0.1°C. We assume that the reduction in air pollution falls to effectively zero, adding in the last 0.2°C of that factor. This gives us a total of 0.4°C.
And then again, we add in the effects of the other feedbacks.
During this decade, we can assume average temperatures will be at over 3.5°C, and so we assume another doubling of the number of forest fires and thus emissions, leading to an addition of 0.16°C (0.08 × 2).
Permafrost melt: The cryosphere report predicts emissions from 3 to 4°C to be 5 to 10 Gt/year. We can assume, then, that these will be 7.5 Gt/year—20% of the 40 Gt/year—and so creating temperature increases of 0.08°C (0.2 × 0.4).
Loss of carbon sinks: We assume a similar effect to the previous decade, adding another 0.05°C.
Albedo effect of ice loss cover: We assume another 0.2°C, as ice at the two poles continues to disappear for more months of the year.
The total this decade then is 0.49°C (0.16 + 0.08 + 0.05 + 0.2), making the total increase in global temperature during this period 0.4 + 0.49, making a total of 0.89°C. Giving a new total of 4.07°C.
2055 to 2065
We assume human emissions remain constant to the extent of creating 0.1°C, and the other feedbacks are as follows.
Forest fires: We assume another doubling of forest fires in a four-degrees-plus world, producing emissions of 0.32°C.
Permafrost melt: We assume this continues to increase by 50% on the previous decade, producing emissions of 0.12°C.
Loss of carbon sinks: We assume a similar loss to the previous decade of 0.05°C.
Albedo effect of ice melt: We assume another 0.2°C loss.
Put this together, and we have 0.69°C (0.32 + 0.12 + 0.05 + 0.2), plus the 0.1°C, making a total of 0.79°C, which makes a total of 4.86°C—effectively reaching five degrees centigrade of global warming.
Pathway to Human Extinction
The historical record of the Earth shows that in previous periods of runaway climate change, the result was a hothouse Earth. Most life on land died due to a fatal reduction in the quantity of oxygen in the atmosphere.14 This was due to the die-off of phytoplankton in the oceans, which produces 50% of the world's oxygen.
Research shows that phytoplankton do not survive at temperatures of five degrees centigrade of global warming and may even die at lower temperatures due to the speed of the temperature increases that will occur this century.14,15
So, it is effectively certain that after passing five degrees centigrade, human extinction is locked in. The decline in oxygen levels will take place over centuries, but humanity will not survive in its remaining ecological niches in the longer term.
There are other possibilities of human extinction, such as from radiation fallout (nuclear winter) from nuclear war and/or nuclear accidents. But this is not certain. Extinction due to loss of oxygen, however, seems to be absolute and is locked in once the threshold of five degrees centigrade is past.
We are presently putting carbon into the atmosphere between 8 and 30 times faster than any time in the Earth's history.16,17 It should not be surprising, then, to find that five degrees centigrade is passed around 2065, according to the above all-system analysis, leaving another 35 years—three more decadal iterations—before we reach 2100. So even if the temperature increases are stretched out, it is certain that five degrees centigrade will be passed before the end of the century and will continue to increase over the following centuries. The increases, in other words, will not stop.
Escape from extinction: Humanity has a short window to prevent this runaway climate breakdown, involving temperature increases of a half to one degree centigrade per decade. The clear indicator of the coming reduction in fossil fuel use will be the physical economic effects of the climate crisis itself, as temperatures go over two degrees centigrade in 2035.
This reduction in human emissions, however, has shown it will not stop the exponential increase in natural positive feedback processes, producing ever more greenhouse gases. Given that we now know the starting stats and the ratios for these feedbacks, geoengineering and Earth repair technologies will therefore be essential.
If we are to survive, it is estimated that carbon removal will cost between $20 and $70 trillion per year.18 I assume that this figure refers to the removal level required to prevent temperature increases of around three degrees centigrade per decade, based upon recent temperature increases. However, as the above analysis shows, in the decade 2035 to 2045, temperatures will increase by around 0.9°C. And so, if it costs an average of $50 trillion a year to suck sufficient CO2 to stop a 0.3-degree temperature increase, it will cost $150 trillion for 0.9°C.
The present GNP of the USA is around $270 trillion. In addition, it will be necessary to significantly reduce temperatures at the poles, because their temperatures are increasing by 2 to 4 times the global average, in order to prevent albedo effects. This will require various untested solar management projects.
And lastly, massive investment of resources will be required in the context of the direct and indirect consequences of storms, droughts, migration, and economic breakdown, as climatic extremities reduce GDP in the next two decades by 10 to 20%. The needed global effort to deal with these crises will happen at the same time as having to allocate 10 to 20% of global GDP to carbon removal.
This may be technically possible, but it is far from likely due to the suboptimal political conditions brought on by social collapse, wars, and new nationalist and fascist regimes. The key tipping point in the whole system, i.e., the fusion of Earth and human systems, would seem to be around three degrees centigrade12, when objective human, social, and technical capacities will fall below the point needed to remove sufficient amounts of carbon from the air to prevent a runaway temperature increase past five degrees centigrade.
The key decade then will be the one from 2035. The key decade then will be the one from 2035. While the technological know-how will need to be developed and rolled out in the next decade to be ready at scale and for the ten years from 2035. There are three possible responses to the outline I have laid out. Number one: Agreement on both methodology and the input data. Number two: Agreement with the methodology, but not with some of the input data. Number three: Disagreement with both the methodology and the data. While I am sure about the efficacy of the methodology, I am not sure about all the assumptions. I do insist, however, that a newly defined conservative frame should be used, given the irrefutable appropriateness of the precautionary principle in the context of existential collapse. There is only one climatic analysis which is now useful, and that is an all-system iterative model. Any part system model will lead to reckless underestimates of temperature increases, because it will not take account of all system interactions.
I would like readers to get in touch to be involved in creating an open-source citizens model, using this methodology to develop real-time analysis, as new data is produced. This would create a public alternative to the discredited models and ‘mainstream science’ subject to dysfunctional methodologies and political capture. This new approach can inform the new progressive forces which will be needed to guide policy as existing political regimes collapse as conditions exponentially worsen. One more prediction is effectively inevitable, and that is that political revolutions will occur in the next decade as the horrors we face become plain for citizens to see. These revolutions will open up the political space for the small window through which we will survive this century. Revolutionary change then is now essential and therefore should be welcomed. It is, in fact, our only chance to create the miracle of human cooperation and innovation that we need.
I will finish by returning to our analogy of playing Monopoly. When my son was six years old, he started playing the game. He would get excited as you started to build houses. He was still enthusiastic as he landed on other players' properties, and lost his money, and then his houses. The world still seemed open for possibility. Then he would land on another player's hotel, be unable to pay the rent, and so would go out of the game. His face would suddenly change and he would leave the table and have a tantrum. I hope you get the meaning here.
Wake up!
References
- World Meteorological Organization. "WMO confirms 2024 as warmest year on record at about 1.55°C above pre-industrial level." WMO, 2024. https://wmo.int/news/media-centre/wmo-confirms-2024-warmest-year-record-about-155degc-above-pre-industrial-level
- Copernicus Climate Change Service. "Copernicus: June 2024 marks 12th month of global temperature reaching 1.5°C above pre-industrial." Copernicus, 2024. https://climate.copernicus.eu/copernicus-june-2024-marks-12th-month-global-temperature-reaching-15degc-above-pre-industrial
- Hansen, J. et al. "Global Warming Has Accelerated: Are the United Nations and the Public Well-Informed?" Environmental Practice, 2024. https://www.tandfonline.com/doi/full/10.1080/00139157.2025.2434494
- Hausfather, Z. "Factcheck: Why the recent 'acceleration' in global warming is what scientists expect." Carbon Brief, 2024. https://www.carbonbrief.org/factcheck-why-the-recent-acceleration-in-global-warming-is-what-scientists-expect/
- Ramanathan, V. et al. "How Air Pollution Has Put a Brake on Global Warming." Yale Environment 360, 2022. https://e360.yale.edu/features/air-pollutions-upside-a-brake-on-global-warming
- NASA. "New NASA Study Tallies Carbon Emissions From Massive Canadian Fires." NASA Jet Propulsion Laboratory, 2024. https://www.jpl.nasa.gov/news/new-nasa-study-tallies-carbon-emissions-from-massive-canadian-fires/
- Veraverbeke, S. et al. "Carbon emissions from the 2023 Canadian wildfires." Nature, 2024. https://www.nature.com/articles/s41586-024-07878-z
- International Cryosphere Climate Initiative. "State of the Cryosphere Report 2024." ICCI, 2024. https://iccinet.org/statecryo24/
- Pan, Y. et al. "The enduring world forest carbon sink." Nature Communications, 2024. https://www.fs.usda.gov/nrs/pubs/jrnl/2024/nrs_2024_pan_001.pdf
- Friedlingstein, P. et al. "Global Carbon Budget 2023." Earth System Science Data, 2023. https://essd.copernicus.org/articles/15/5301/2023/
- Lenton, T.M. et al. "Tipping elements in the Earth's climate system." Proceedings of the National Academy of Sciences, 2008. https://www.pnas.org/doi/10.1073/pnas.0705414105
- Pistone, K. et al. "Radiative Heating of an Ice-Free Arctic Ocean." Geophysical Research Letters, 2019. https://agupubs.onlinelibrary.wiley.com/doi/full/10.1029/2019GL082914
- Yamaguchi, S. et al. "Global Warming Can Lead to Depletion of Oxygen by Disrupting Phytoplankton Photosynthesis: A Mathematical Modelling Approach." Geosciences, 2018. https://www.mdpi.com/2076-3263/8/6/201
- Keeling, R.F. et al. "Failing phytoplankton, failing oxygen: Global warming disaster could suffocate life on planet Earth." Science Daily, 2015. https://www.sciencedaily.com/releases/2015/12/151201094120.htm
- Köhler, P. et al. "The Carbon Cycle." Earth Observatory, NASA, 2020. https://www.earthobservatory.nasa.gov/features/CarbonCycle
- NOAA. "Climate Change: Atmospheric Carbon Dioxide." Climate.gov, 2023. https://www.climate.gov/news-features/understanding-climate/climate-change-atmospheric-carbon-dioxide
- National Academies of Sciences, Engineering, and Medicine. "Negative Emissions Technologies and Reliable Sequestration: A Research Agenda." The National Academies Press, 2019. https://nap.nationalacademies.org/catalog/25259/negative-emissions-technologies-and-reliable-sequestration-a-research-agenda